Was dir deine Auslastungsrate wirklich sagt (und was nicht)
Your team might feel busy – calendars packed, Slack buzzing, deadlines everywhere. But busy doesn’t equal productive, profitable, or balanced. That’s where utilization rate comes in: a simple way to see how much of your team’s time is spent on meaningful work, not just motion.
Low utilization signals gaps like unclear priorities or workflow friction. Too high for too long points to overcommitment, burnout risk, and slipping quality.
In this article, we’ll cover what utilization rate is, how to calculate it, how to read it across roles, and how to improve it sustainably, without overloading your team.
Quick clarification: Total utilization rate vs. billable utilization rate
⚠️ Before we go deeper, one important note. Many people Googling “utilization rate” are actually looking for billable utilization rate – the percentage of available time spent on work that can be billed to clients (aka billable hours). That metric matters, but it’s narrower in scope.
This article focuses on total utilization, which measures how fully someone’s working time is used across all productive work, whether client-facing or internal. If you need the difference explained in detail, we cover that in a separate guide: Billability vs utilization.
Die wichtigsten Erkenntnisse
- Utilization rate shows the percentage of available work time spent on meaningful, productive tasks.
- Productive time includes billable work and non-billable internal work that moves projects forward.
- Non-productive time includes idle time, waiting, unnecessary meetings, rework, and friction in workflows.
- Utilization rate formula: (Productive hours ÷ Available hours) × 100.
- Healthy utilization typically falls between 65–85%, depending on role and industry.
- Average utilization rate for core contributors is 75–85%, for PMs: 60–75%, for leaders: 50–70%.
- Aiming for 100% utilization almost always backfires – it removes buffer, increases mistakes, and exhausts the team.
- Improving utilization rates is about removing friction and planning better – not squeezing more hours out of people.
What is utilization rate? Definition
Utilization rate is the percentage of an employee’s available work time that goes into productive tasks. Productive tasks include both billable work and the internal activities teams need to deliver projects effectively – such as project planning, communication, documentation, research, and training.
What utilization does not include is non-productive or idle time (often called bench time): hours when someone is available but has no meaningful work assigned due to delays, gaps between projects, or unclear priorities.
💡 Recommended article: Billable hours vs actual hours
Utilization rate formula with example
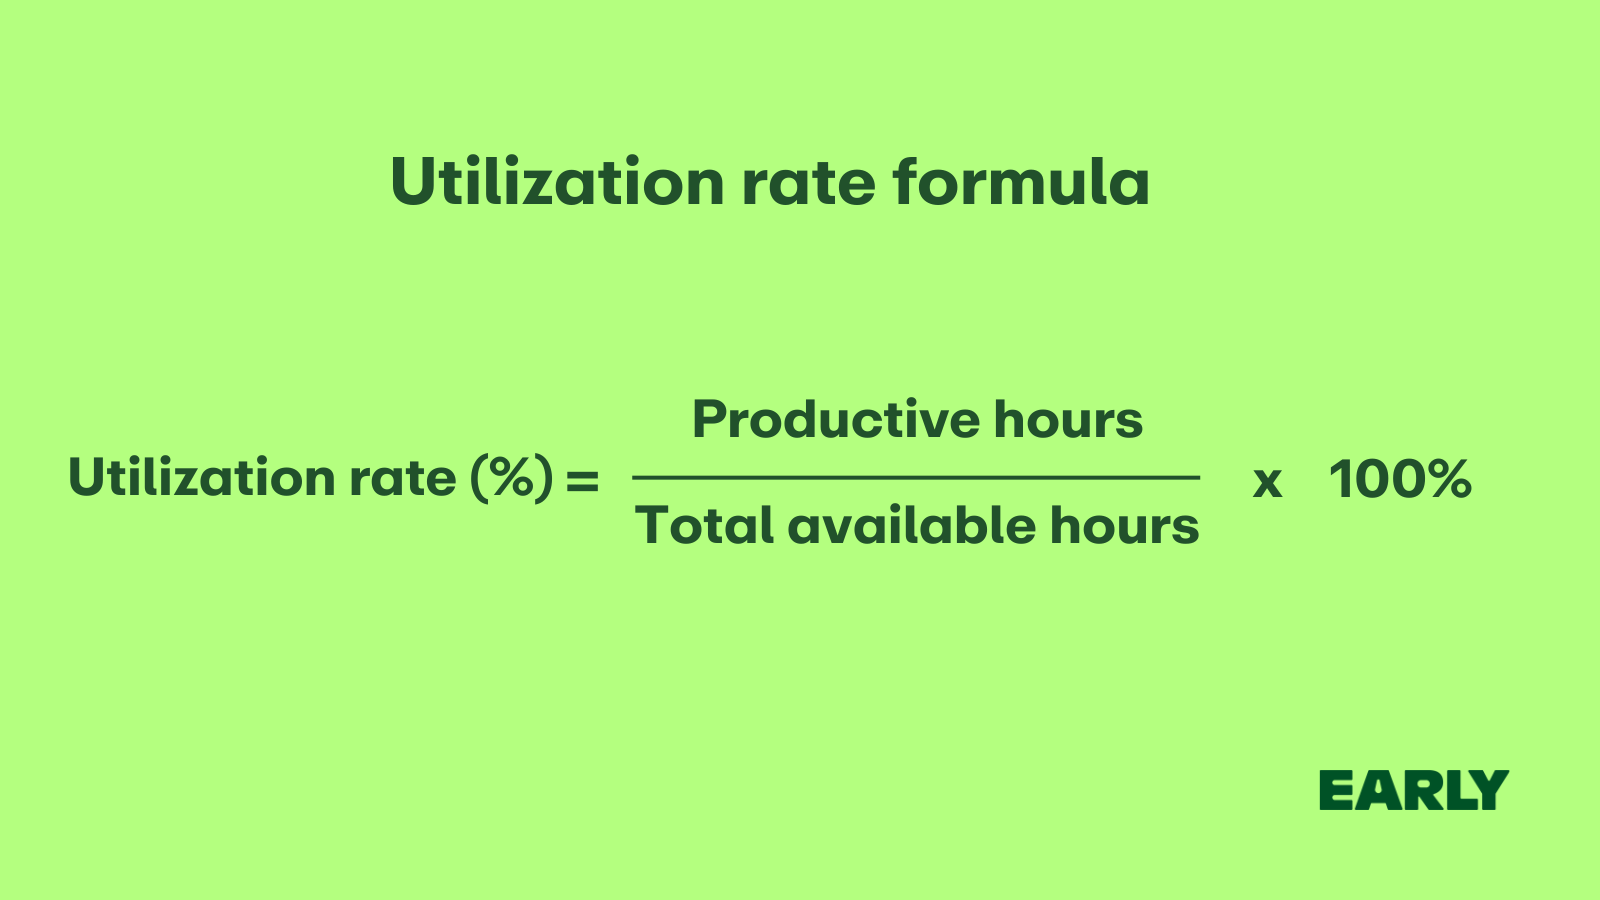
The utilization formula is:
Utilization rate (%) = (Productive hours ÷ total hours) × 100
Where:
- Productive hours = billable + meaningful internal work
- Total hours = scheduled work hours minus PTO, holidays, sick days, and planned training
Let’s say you work a 40-hour week. Your time breaks down like this:
- 25 hours billable
- 7 hours internal project meetings, documentation, or planning
- 8 hours unassigned (idle/bench time)
Productive hours = 25 + 7 = 32
Utilization rate = (32 ÷ 40) × 100 = 80%
That means 80% of your available time went into work that moved projects forward, while the remaining 20% was spent on necessary non-project time – things like admin work, context switching, breaks, or buffer time. It’s not about aiming for 100% – healthy teams need that margin.
💡 Please note: Billable utilization rate formula works in a similar way.
👉 Recommended article: Project billing 101
How to calculate utilization rate: Step-by-Step
Calculating your or your team member’s utilization rate is quite simple: divide productive hours by total available hours. The result shows how effectively your or your team’s capacity is being used.
Here is a step-by-step guide on how to calculate utilization rate:
1. Define the time window
Start by choosing a time period for which you want to calculate utilization rate – usually it’s a week, a month, or a quarter.
To get comprehensive data that allows you to compare utilization rates week over week, month over month or quarter over quarter, you need to diligently track time every day.
This consistency makes it easier to identify real trends over time. Tracking utilization rate weekly highlights short-term shifts, while monthly or quarterly tracking reveals broader patterns.
💡 Please note: Manual time tracking is consuming and error-prone. Make sure to automate time tracking with a dedicated automated time tracking software.
2. Set “available hours” per person
Determine how many hours each team member is actually available to work during your chosen time period. Calculate the total hours (working days × hours per day), and subtract time off such as vacation (PTO), public holidays, sick days, and planned training sessions.
The result gives you each employee’s available hours, which form the baseline for calculating utilization rates.
Formula:
Available hours = (Workdays − PTO − Holidays − Sick days − Training) × Hours per day
3. Categorize tasks as billable, non-billable, and non-productive
To calculate utilization accurately, you need a realistic breakdown of where time goes. Not all hours move work forward in the same way, and some don’t contribute to progress at all. A reliable utilization model separates time into three categories:
- Billable hours: Time spent on client-facing work that generates revenue. It’s productive, measurable, and directly tied to output.
- Non-billable productive hours: Internal work that still contributes to progress, even if it doesn’t show up on an invoice. These hours count toward utilization because they support delivery and performance. The non-billable but productive tasks include:
- planning and coordination
- internal meetings
- documentation and process work
- internal projects
- research and preparation
- training and skill development
- Non-productive hours: Time that doesn’t contribute to progress or to the revenue. It can either be bench time when a person has no tasks assigned at all or unproductive time like context switching, administrative drag or decision-making bottlenecks. It affects every role, including senior and leadership roles.
💡 Please note: For team leads and managers, non-productive time often accumulates in the form of unstructured interruptions: unexpected escalations, constant context shifts, approvals, follow-ups, or last-minute decisions. All necessary to some degree, but not always additive to real progress.
👉 Recommended article: What is block billing?
4. Track all hours (use time tracking software)
Make sure every team member logs all their working hours, both billable and non-billable time, using an automated time tracker like EARLY. This provides a complete picture of how time is spent across tasks, projects and internal activities.
💡 Tip: When you tag each task as billable or non-billable in EARLY, it will automatically calculate total billable and non-billable hours for a chosen period.
5. Calculate individual utilization
Use the tracked data to determine how much of each person’s available time was spent on productive work. This helps you see how efficiently their hours are being used and identify potential imbalances in workload.
Formula:
Utilization rate (%) = (Productive hours ÷ Available hours) × 100
6. Calculate the team’s utilization rate
Add together the productive and available hours for everyone on the team to see how efficiently your overall capacity is being used. Then, divide the total productive hours by the total available hours and multiply by 100 to get your team’s utilization percentage.
Formula:
Team utilization (%) = (Total productive hours ÷ Total available hours) × 100
7. Compare to targets and costs
Review your team’s utilization rate in the context of your desired profit margin and each role’s expected workload.
- If utilization is too low, your labor and resource costs increase for each deliverable, reducing profitability.
- If it’s too high, your team may be overworked, leading to burnout and a drop in quality.
Aim for a balanced rate that supports both healthy profit margins and sustainable performance.
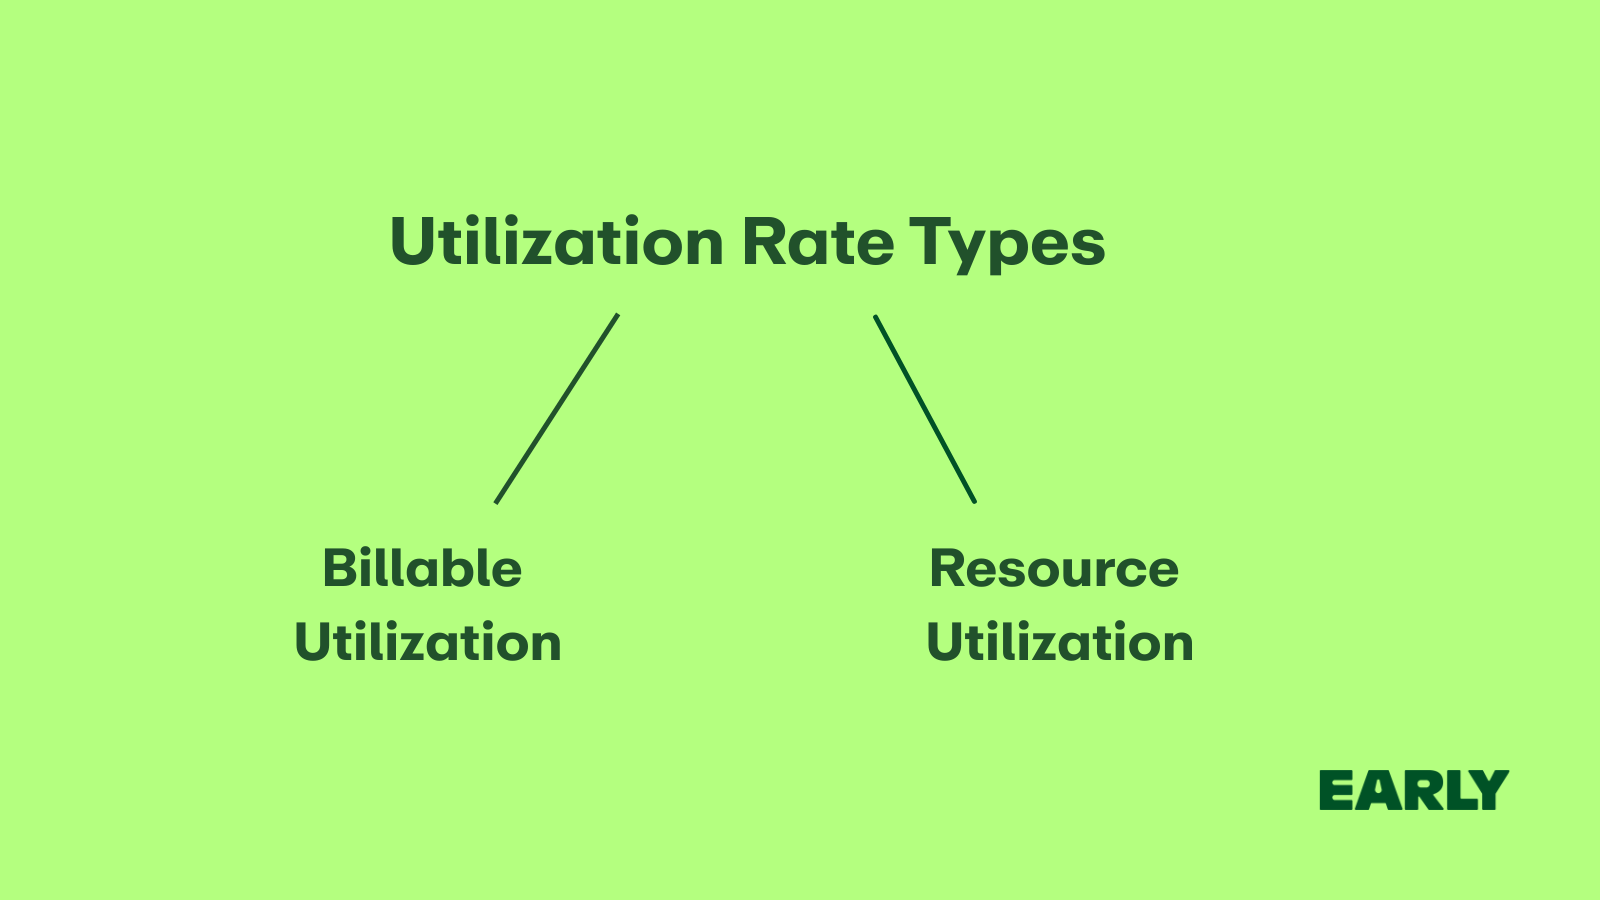
Two types of utilization rate
Not every hour on the clock serves the same purpose. That’s why there are two main ways to measure how time is used: billable utilization and resource utilization.
TLDR: Billable utilization shows how much time earns money, while resource utilization shows how much time drives progress.
Billable utilization
Billable utilization focuses on revenue. It measures how much of an employee’s time is spent on client work that can be invoiced.
- Who uses it: Agencies, consultancies, law firms, and freelancers.
- Why it matters: It shows how efficiently the team turns working hours into income.
- Example: If a consultant works 40 hours and bills 32 of them to clients, their billable utilization is 80%.
Resource utilization
Optimal resource utilization focuses on capacity. It measures how effectively an organization uses its total available hours.
- Who uses it: In-house teams, product companies, and operations managers.
- Why it matters: It helps plan workloads, track productivity, and make sure people aren’t overloaded or underused.
- Example: If a software developer spends 35 out of 40 hours on active project work, their resource utilization is 87.5%.
Why monitoring utilization rate matters (and who actually cares)
Utilization matters because it highlights whether people are using their time on work that moves projects forward. When utilization rate is too low, it suggests inefficiency, poor planning, or inconsistent workload. When it’s too high, it’s often a sign that teams are overstretched and at risk of burnout.
If you’re trying to run a profitable business and keep your team sane, utilization rate is one of the critical metrics you can’t ignore. Different roles care about it for different reasons:
- Agency owners and consultants use utilization to safeguard profit margins, optimize workloads, and ensure client projects are staffed appropriately.
- Project and resource managers use it to manage employee workload, ensuring no one is drowning in tasks or sitting idle. It’s the foundation for smarter resource allocation and more predictable delivery timelines.
- Finance and operations teams rely on utilization data to connect time, cost, and output – a key piece of improving employee productivity and overall business efficiency.
- Internal team leads (in marketing, product, or design) monitor it to make sure people spend time on high-impact work instead of endless meetings, supporting both performance and employee satisfaction.
- Freelancers and contractors care about utilization because it directly affects income, capacity, and client outcomes – and higher efficiency often translates into better customer satisfaction.
Monitoring utilization rate isn’t just about time tracking. It’s about finding the right balance between productivity, profitability, and people’s well-being.
What is a good utilization rate?
There’s no single “perfect” utilization rate target for everyone. The optimal utilization rate depends on your industry, your team’s structure, and how you balance billable and non-billable work.
Please note: A healthy team’s utilization rate ensures strong performance and profitability without pushing people into burnout.
Let’s look at what a good team’s utilization rate should be across different types of businesses and roles.
Based on business type
For professional services like consultancies, law firms, and agencies, a healthy employee utilization rate usually sits around 75–85%. These teams spend most of their time on structured, deliverable-oriented work, with the remaining gap coming from admin, delays, approvals, rework, or interruptions.
In product companies or internal teams, the average utilization rate typically falls around 70–80%.
Product work includes research, planning, discovery, and cross-functional alignment – all productive, but less linear and more iterative. The remaining capacity is absorbed by unavoidable overhead and operational friction.
Creative and marketing teams often aim for 65–75% of employee utilization rate. Creative work requires exploration, ideation, experimentation, and revision cycles. A lower rate helps protect quality while acknowledging natural non-productive overhead.
Based on role type
Not everyone in your organization should aim for the same utilization rate target. Different roles contribute to your team’s utilization rate in distinct ways, depending on how much of their time is billable work versus strategic or administrative tasks (usually non-billable time). Understanding these differences helps you set fair expectations and improve overall efficiency for your team members.
- Designers, developers, and analysts: Typical target: 75–85%. Most of their time goes into producing deliverables and advancing projects. Their non-productive time mainly comes from context switching, admin, or project delays.
- Project managers: They generally aim for 60–75% utilization rate. PMs split their time between execution and coordination. Much of their work is productive but doesn’t produce direct deliverables, so their utilization cap is naturally lower. Non-productive time comes from bottlenecks, reactive firefighting, or process friction.
- Leaders, partners, and senior managers: Usually their goal is 50–70% utilization rate. Leaders invest significant time in strategy, coaching, decisions, relationships, and long-term growth – all productive but not counted as direct project execution. Their non-productive time generally comes from interruptions, escalations, and operational overhead.
Linking utilization to billing
When calculating your optimal billing rate, it’s important to base it on billable utilization, not overall utilization. The optimal billing rate formula connects your average utilization ratio, total billable hours, and revenue goals to ensure you can maintain profitability.
The logic is straightforward:
- If your team’s billable utilization rate is lower, your optimal billing rate needs to be higher to cover overhead costs and still hit your revenue targets.
- If billable utilization is higher, you can stay competitive with lower billing rates while maintaining strong margins.
💡 Recommended article: How to calculate your billable hourly rate
How to increase utilization rate?
Your team’s capacity utilization rate might not be where you’d like it to be – but that doesn’t mean drastic measures are needed. Before making quick fixes, it’s worth taking a closer look at a few strategic areas that can help you improve employee utilization, reduce labor costs, and strengthen your profit margins.
💡 A small but important tip: Consistent time tracking makes capacity planning so much easier. It gives you a clear picture of where hours are spent, helping you improve productivity, control labor costs, and plan projects with confidence.
👉 Recommended article: How to calculate labor costs
1. Reduce non-productive work and time drains
Start by identifying which activities don’t contribute to meaningful progress – excessive meetings, delays, unclear workflows, rework, or administrative tasks. Non-productive hours increase operational costs without adding value. Streamlining processes and eliminating unnecessary friction frees up time for focused, high-impact client work.
💡 Related article: How to increase billable hours
2. Build a consistent project pipeline
Gaps in workload lower utilization, even though your team’s capacity remains constant. Whether you work with internal stakeholders or external clients, improving forecasting, smoothing demand, and planning ahead helps keep teams steadily engaged and reduces unassigned or idle time.
3. Align team size with workload
If your data shows a consistent shortfall in employee utilization, it may indicate a mismatch between team size and available work. This directly affects labor costs and your target profit margin. Reviewing workload patterns and capacity helps you understand whether you’re overstaffed, understaffed, or simply misaligned – allowing you to adjust roles, redistribute work, or refine priorities.
4. Optimize resource allocation
Effective resource management means matching the right people to the right projects. Assigning senior team members to junior-level tasks leads to unnecessary resource costs and reduced efficiency. Use resource utilization tracking insights to align skill levels with project complexity, ensuring that every hour contributes meaningfully to results.
5. Automate routine processes
Manual time tracking, invoicing, and reporting drain focus and increase non-productive time. Automating repetitive tasks reduces business costs, improves accuracy, and makes it easier to measure productivity. Tools that track time automatically in the background can help employees focus on higher-value work.
6. Strengthen project scoping and planning
Poorly defined project scopes often lead to scope creep, which inflates the number of hours worked and erodes profitability. Clear contracts, well-defined deliverables, and consistent communication with clients can help protect your target profit margin and ensure sustainable employee utilization.
7. Minimize context switching
Constantly switching between multiple projects decreases efficiency and increases labor costs. Encourage focused work blocks to help employees maintain concentration and deliver higher-quality output. This approach not only boosts productivity but also provides a more accurate view of true utilization.
💡 Recommended article: How to improve focus
Should you target utilization rate of 100%?
My advice? Don’t aim for 100%. At first glance, 100% utilization sounds ideal. Every hour billed, every person fully booked. But in reality, it’s not sustainable. When your team is operating at full capacity, there’s no time to pause, reflect, or improve. Creativity and problem-solving happen in the space between tasks, and that space disappears when every minute is spoken for.
A team running at 100% might look efficient, but it quickly becomes rigid and overworked. There’s no buffer for unexpected requests, learning, or fixing mistakes. The most effective companies aim for 75–85% utilization – a range that keeps productivity high while leaving room for innovation, quality, and balance.
Fazit
Utilization rate is a powerful key metric, yet a tricky one. It tells you how effectively your team turns time into value – but it doesn’t show the whole story. The goal isn’t to reach 100%, but to find a sustainable balance that keeps profits strong and people healthy.
FAQ
Does utilization rate include PTO?
No, utilization rate includes only available work time, without PTO, sick leave or public holidays.
What is the meaning of utilization ratio?
The utilization ratio shows the percentage of available working time spent on productive, revenue-generating tasks versus non-billable tasks which are non-productive.
What is the standard utilization rate?
The standard rate is usually 70–80% across service and knowledge-based teams. It balances productivity with enough slack for admin work, breaks, and unexpected tasks.
What is the optimal utilization of staff?
Most organizations consider around 75% to be the sweet spot. It keeps people productive without pushing them into overload or burnout.
What does 75% utilization mean?
It means an employee spends 75% of their available work time on core, productive, or billable tasks. The remaining 25% naturally goes to bench time or non-productive overhead.
What is capacity utilization rate?
The capacity utilization rate is the utilization for a company’s average employee.
How to set an optimal billing rate?
To achieve profitability, companies must set their billing rates based on the average employee billable utilization rate and ensure these rates cover all expenses. Understanding the optimal billing rate involves calculating total labor costs and overhead costs before determining the price to charge clients.
What are total average labor hours?
Total average labor hours are the average number of hours your team is available to work over a given period, including both productive and non-productive time.